Integrated Healthcare Data PlatformIntegrated Healthcare Data Platform: IHDP (Integrated Healthcare Data Platform) is a concept for the complex network of healthcare service…Nov 4, 2022Nov 4, 2022
How to get resources from Kubernetes Cluster using Kubectl ?In this article we will look into some commands to get resources from Kubernetes cluster using Kubectl.Nov 19, 2021Nov 19, 2021
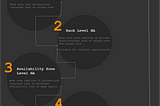
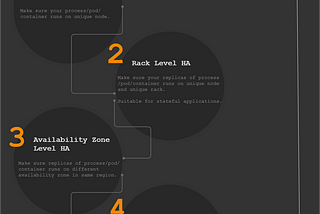
High Availability Framework to adopt for Failure and Disaster Recovery | KuberneteslabIt is an expert opinion about Business Continuity Planning for IT applications concerning HA (High Availability Framework). This post is…Nov 19, 2021Nov 19, 2021
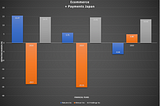
Operating Margin in Ecommerce and Digital Payments in Japan AnalysisI have done the analysis of the operating margin with the financial results from three major companies in Japan.Aug 20, 20211Aug 20, 20211
This article is published by kuberneteslab.In shared linux server environment it is important to track the usage of high CPU consuming processes.Feb 20, 2021Feb 20, 2021
Keep Specific Metrics in Prometheus through Prometheus JobThis is 1m read article written by Kuberneteslab. In this article we will discuss about the keep action for keeping certain metrics in…Feb 9, 2021Feb 9, 2021
How to check the Disk Statistics on Linux using Terminal ?This is 1m read article written by Kuberneteslab. In this article we will discuss about the disk statistics and how to view it through…Feb 9, 2021Feb 9, 2021
How to get resources from Kubernetes Cluster using Kubectl ?Get Resources from K8S Cluster using Kubectl cmd:Feb 7, 2021Feb 7, 2021